Plant Performance
The Plant Performance interface provides real-time monitoring, anomaly detection, and maintenance planning for your solar assets.
Overview
The O&M Administration Panel is the central hub for managing plant operations. It implements the OODA Loop (Observe, Orient, Decide, Act) methodology for systematic anomaly detection and resolution.
Navigation
The interface is organized into six main sections:
| Section | Purpose |
|---|---|
| Dashboard | Real-time metrics and portfolio overview |
| Issues | Anomaly detection and issue tracking |
| Performance | Performance analytics and forecasting |
| Maintenance | Maintenance planning and BOM management |
| Inventory | Component tracking and stock management |
| Settings | Configuration and preferences |
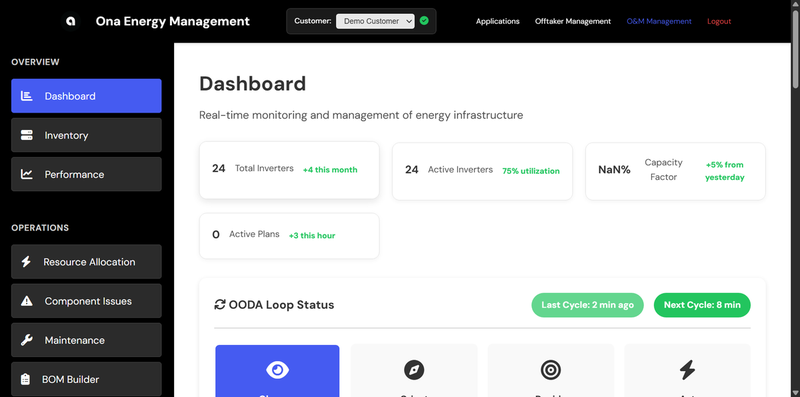
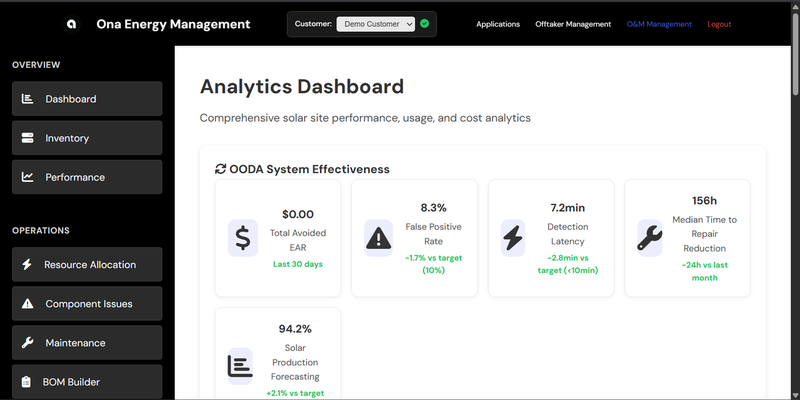
Dashboard
The Dashboard provides a real-time overview of your portfolio’s health and performance.
Key Metrics
- Total Power Output - Current generation across all assets
- Active Inverters - Number of inverters currently producing
- Average Capacity Factor - Portfolio-wide efficiency
- Temperature - Average inverter temperature
- Financial Impact - Revenue and cost tracking
Real-Time Updates
Data refreshes automatically every 5 minutes. Use the time range selector to view:
- Last hour
- Last 6 hours
- Last 24 hours
- Last 7 days
Performance
The Performance section provides detailed analytics on asset performance over time.
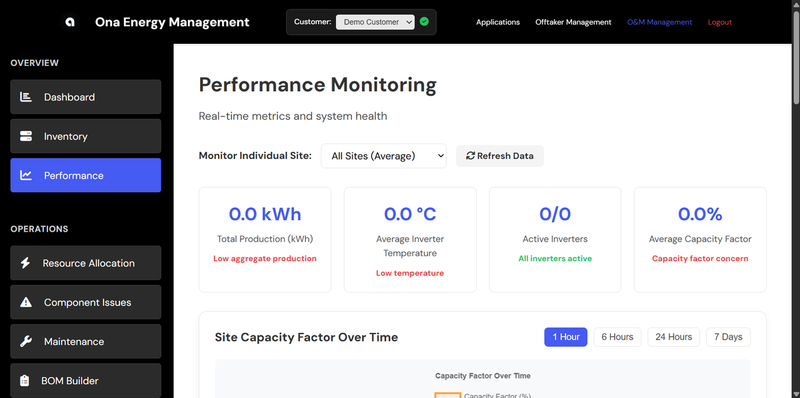
Features
- Forecast vs Actual - Compare ML forecasts against actual production
- Capacity Factor Trends - Track efficiency over time
- Temperature Monitoring - Monitor inverter thermal performance
- Power Curves - Visualize generation patterns
Forecast Comparison
The forecast comparison chart shows:
- Blue line: ML-generated forecast
- Green line: Actual production
- Shaded area: Confidence interval
Deviations between forecast and actual may indicate equipment issues or weather anomalies.
Issues (OODA Loop)
The Issues section implements anomaly detection using the OODA methodology.
OODA Phases
- Observe - Automatic anomaly detection from telemetry data
- Orient - Root cause analysis and diagnosis
- Decide - Maintenance planning and prioritization
- Act - Work order execution and tracking
Issue Severity
| Severity | Description | Action Required |
|---|---|---|
| High | Significant production loss or safety concern | Immediate attention |
| Medium | Notable performance degradation | Schedule within 48 hours |
| Low | Minor deviation from expected performance | Monitor and schedule |
Issue Tracking
Each issue includes:
- Asset ID - Affected equipment
- Anomaly Type - Classification of the issue
- Energy at Risk - Estimated production loss (kWh)
- Financial Impact - Cost of inaction (USD)
- Status - New, In Progress, Resolved
Maintenance
The Maintenance section handles maintenance planning and Bill of Materials (BOM) management.
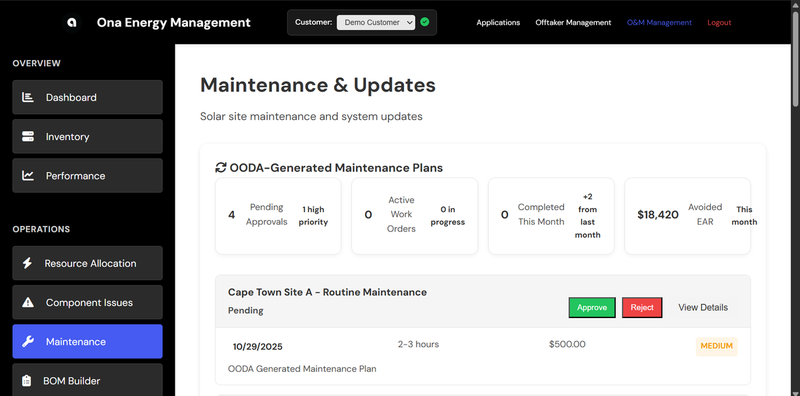
Maintenance Plans
Create maintenance plans linked to detected issues:
- Priority - High, Medium, Low
- Type - Corrective, Preventive, Predictive
- Estimated Cost - Labor + parts
- Duration - Estimated hours
- Scheduled Date - Planned execution
Bill of Materials (BOM)
Generate BOMs for maintenance activities:
- Part Numbers - Component identifiers
- Quantities - Required counts
- Unit Costs - Individual component pricing
- Suppliers - Vendor information
- Lead Times - Expected delivery
Inventory
Track components and stock levels across your portfolio.
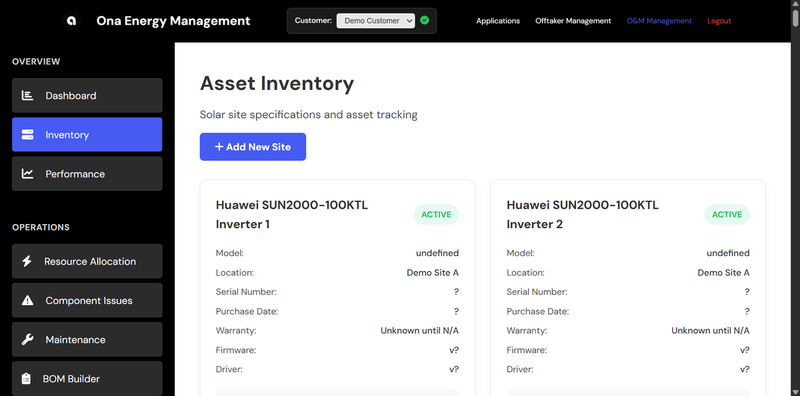
Features
- Stock Levels - Current inventory counts
- Reorder Points - Automatic alerts when stock is low
- Order Tracking - Monitor pending deliveries
- Usage History - Track component consumption
Analytics
Advanced analytics for portfolio optimization.
Reports
- Performance Reports - Weekly/monthly summaries
- Lender Reports - Covenant compliance tracking
- Maintenance Reports - Work order history
- Financial Reports - Revenue and cost analysis
Settings
Configure system preferences and integrations.
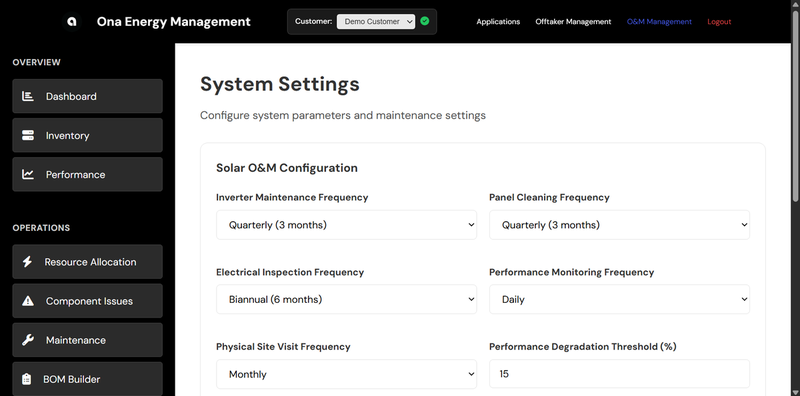
Options
- Notification Preferences - Email and alert settings
- Currency - Display currency selection
- Time Zone - Local time settings
- API Keys - Integration credentials
- User Management - Team access control
API Integration
All dashboard data is accessible via the Ona API for custom integrations.
Key Endpoints
POST /terminal/nowcastUI    - Real-time telemetry
POST /terminal/forecast     - ML forecasts
POST /terminal/detections   - Anomaly detections
POST /terminal/diagnostics  - Root cause analysis
POST /terminal/issues       - Issue tracking
POST /terminal/schedule     - Maintenance plans
POST /terminal/bom          - Bill of materials
POST /terminal/assets       - Asset registry
See the API Reference for full documentation.
Support
For assistance with the Plant Performance interface:
- Email: support@asoba.co
- Discord: Join our community
- Documentation: API Reference