
Discovery
Discovery is Zorora’s Leaflet-based geospatial view for finding candidate sites — mineral deposits, generation assets, transmission zones, substations, and supply areas — before they enter the Scouting pipeline.
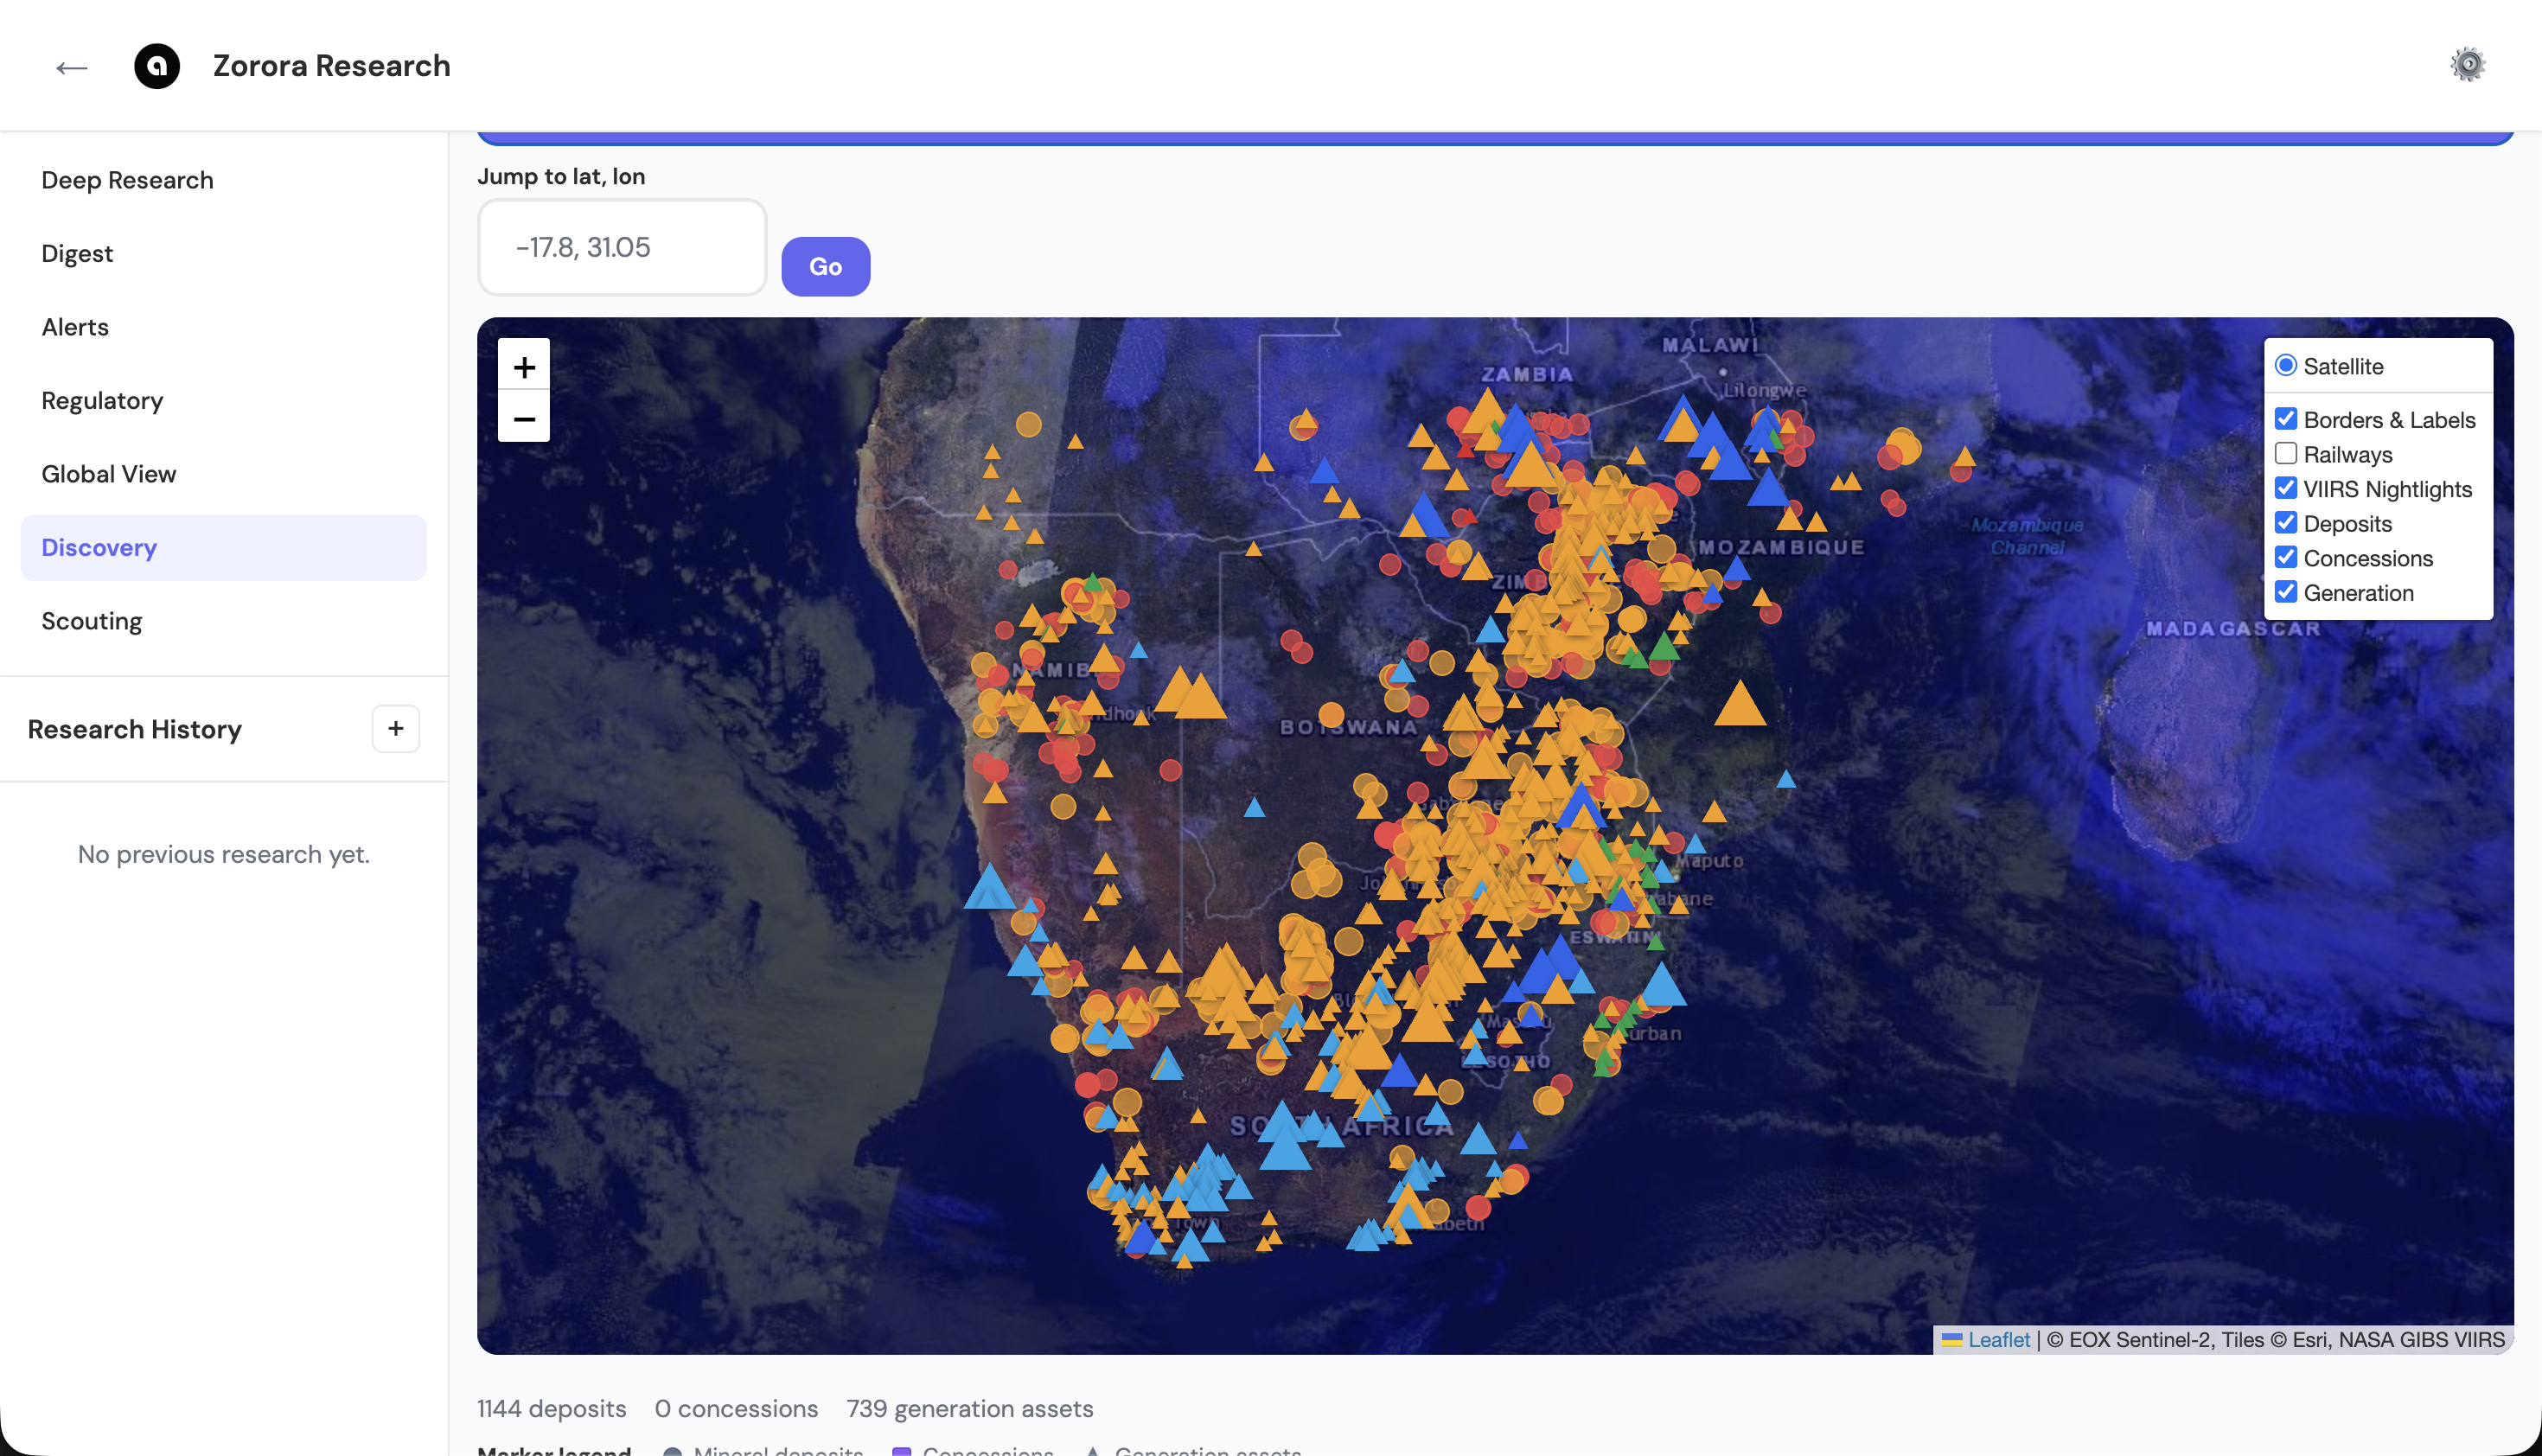
Discovery's satellite view with VIIRS Nightlights, Deposits, Concessions, and Generation layers toggled on
Map Layers
| Layer | Source | Shown as |
|---|---|---|
| Deposits | USGS MRDS | Circle markers, colored by commodity |
| Generation | GEM (Global Energy Monitor) | Triangle markers, colored by technology |
| Concessions | GCCA transmission zone data | Polygon overlays |
| Substations & supply areas | GCCA | Point markers with viability scoring overlays |
| VIIRS Nightlights | NASA | Raster overlay for load-center proxy |
| Borders & Labels / Railways | Basemap | Toggleable reference layers |
Use the Jump to lat, lon field to center the map on a known coordinate, or pan and zoom directly. Layer visibility is controlled from the panel in the top-right of the map.
From Map to Site Card
Clicking any marker opens a popup with the asset’s core attributes.
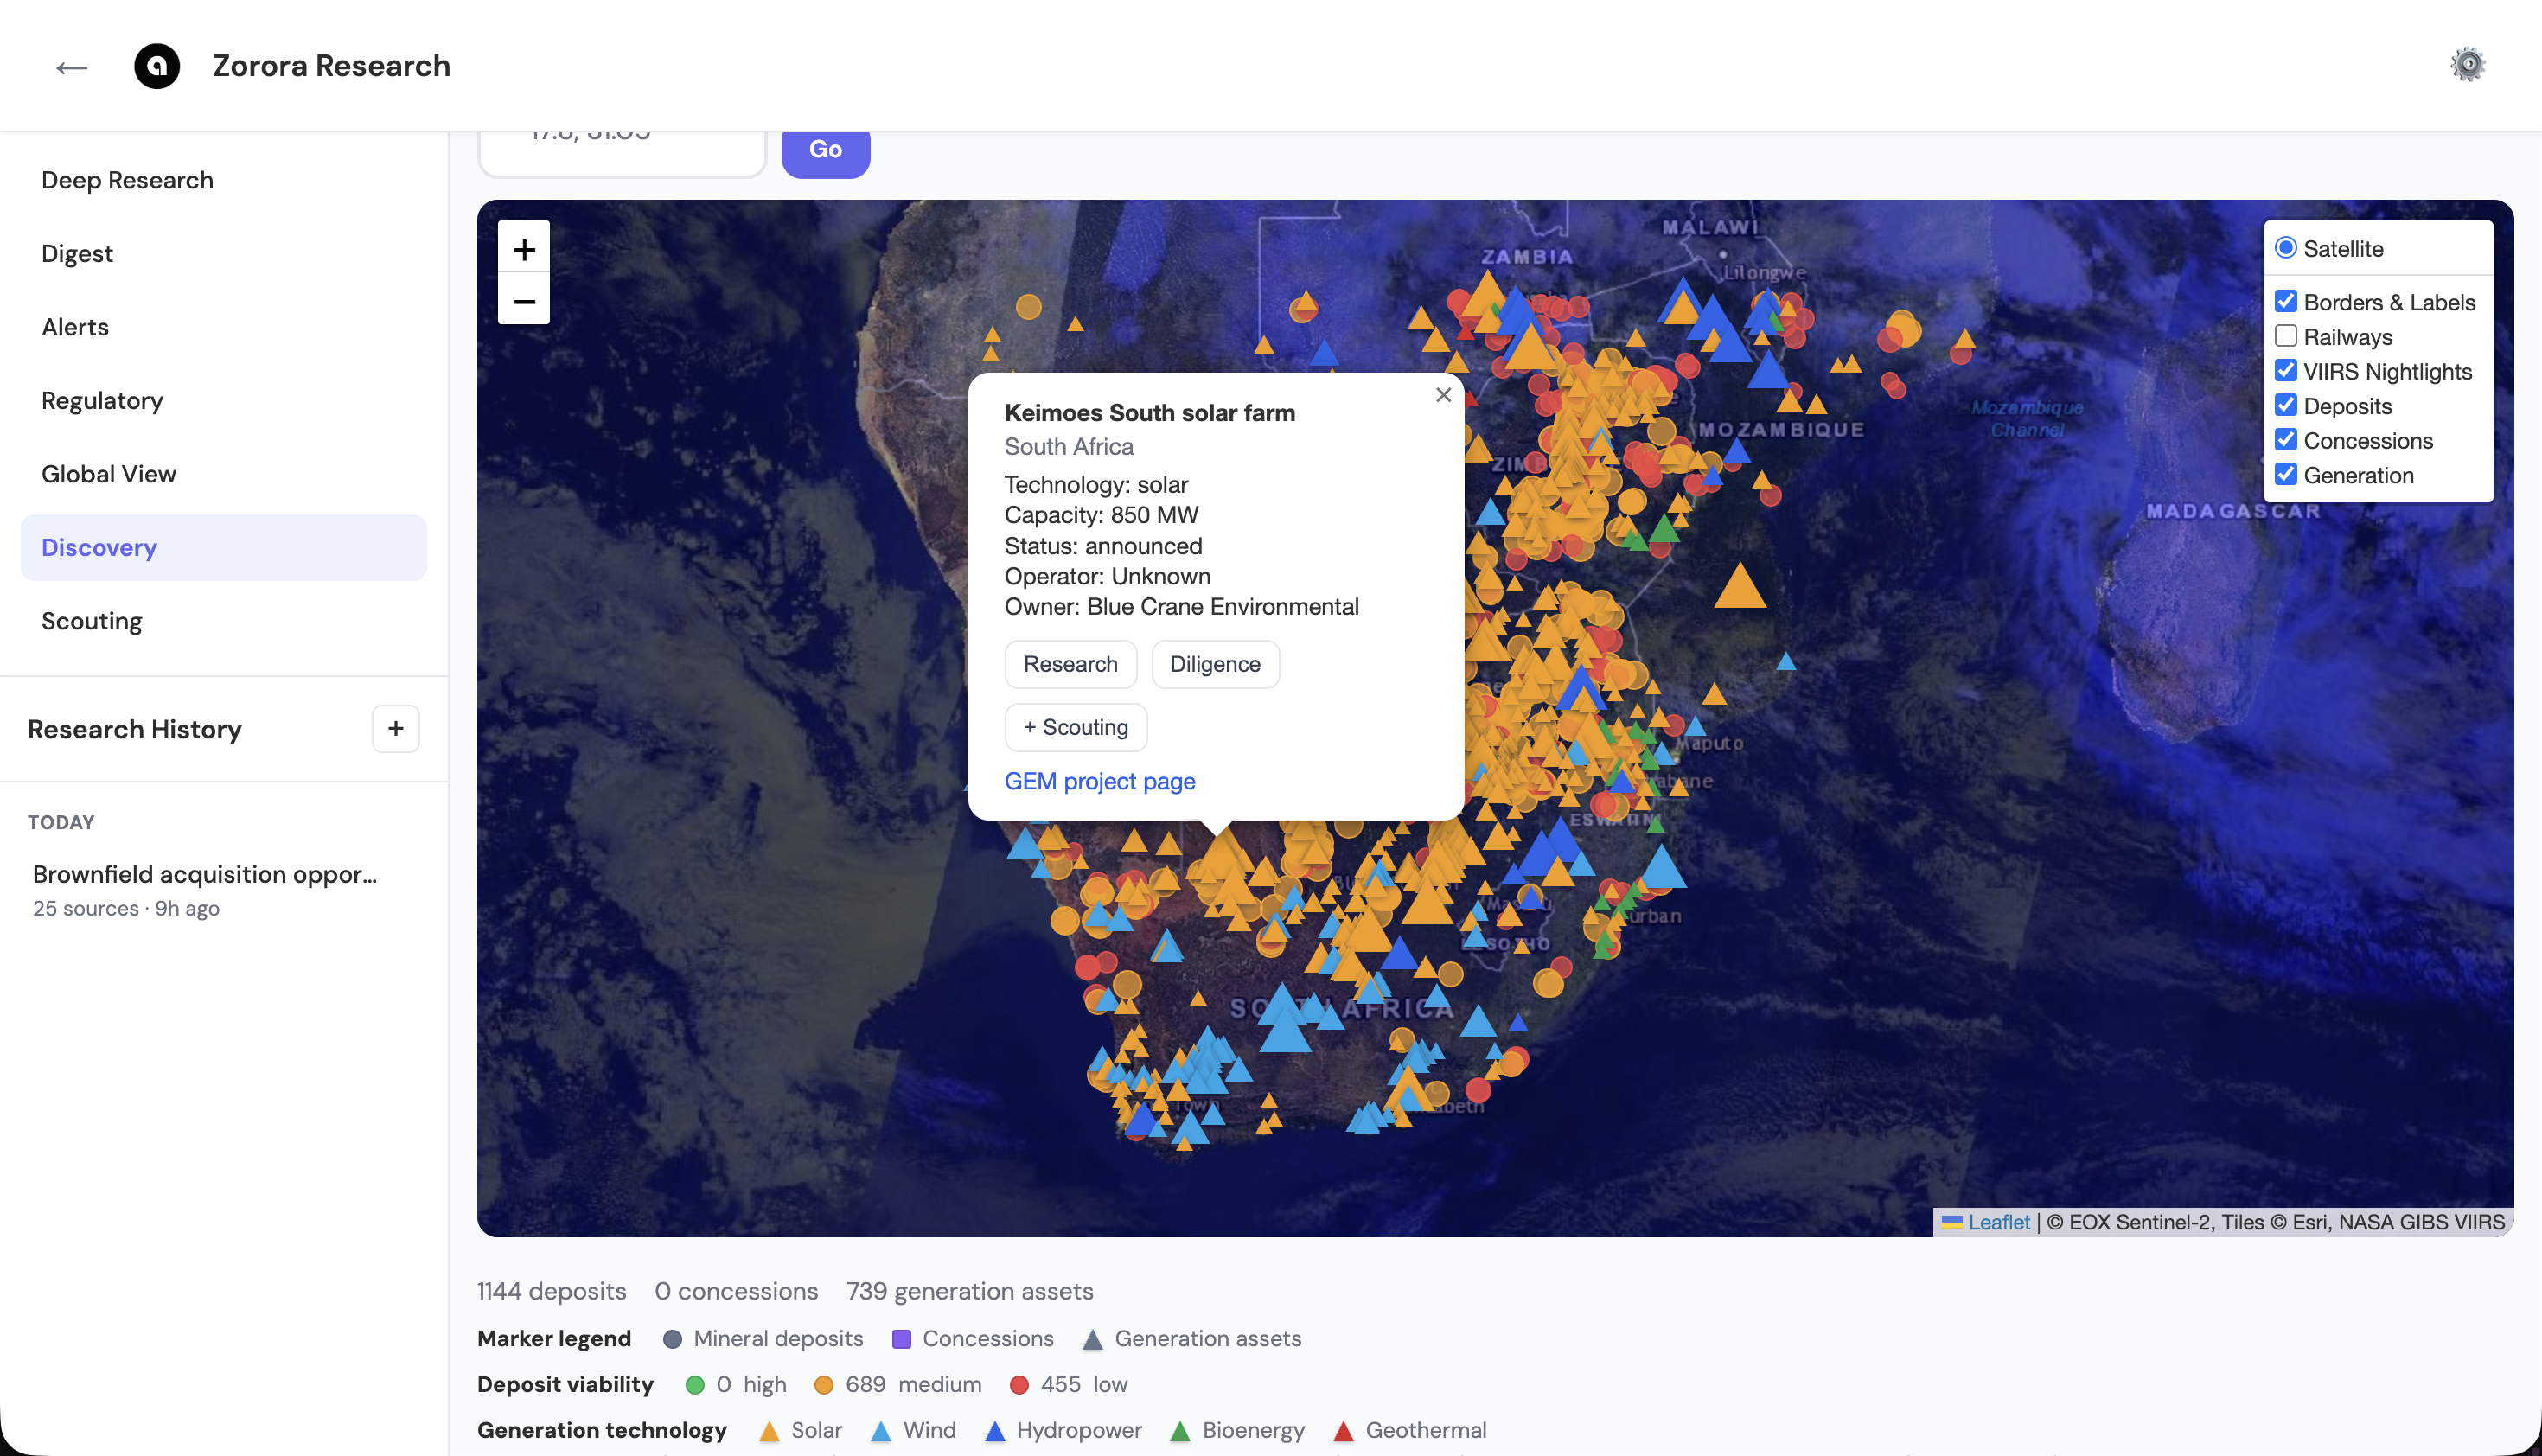
A generation-asset popup: Technology, Capacity, Status, Operator, and Owner, with Research, Diligence, +Scouting, and a link to the source GEM project page
For a generation asset, the popup shows Technology, Capacity, Status, Operator, and Owner. For a mineral deposit, it shows commodity and deposit type instead. Every popup carries:
- Research — opens a Deep Research query scoped to that asset
- Diligence — launches a diligence search against that specific site
- + Scouting — adds the site directly to the Scouting pipeline’s Identified column
- A link back to the source record (e.g. the GEM project page for a generation asset)
Handing Off to Scouting
Discovery is where a candidate is found. Scouting is where it’s tracked and scored. The two are meant to be used together:
- Locate a candidate site in Discovery — by browsing the map or jumping to known coordinates
- Open the asset popup and review its baseline attributes
- Click + Scouting to add it directly to the Identified column, or run Research/Diligence first if you need more context
- From there, Scouting takes over: resource, grid, regulatory, and financial scoring, then a full feasibility study
This means Discovery’s map counts double as a sourcing tool: as of this writing, it surfaces 1,144 mapped mineral deposits and 739 generation assets across the SADC region, all of which are eligible to enter the Scouting pipeline directly from the map.
Related
- Scouting — the pipeline a Discovery candidate feeds into
- Data Sources — USGS MRDS, GEM, and GCCA provider detail
- Deep Research — what a Research hand-off from a map popup produces