
Scouting
Scouting is Zorora’s kanban pipeline for taking a candidate site from first identification through to a go/no-go decision, with automated feasibility scoring at every stage. It’s where a site found in Discovery gets tracked, scored, and diligenced.
Scouting is gated to the Enterprise plan. On lower tiers, the hosted UI shows a static Scouting shell with an upgrade prompt instead of the live pipeline — entitlement is checked reactively against the
featuresfield returned by/api/auth/me.
The Pipeline
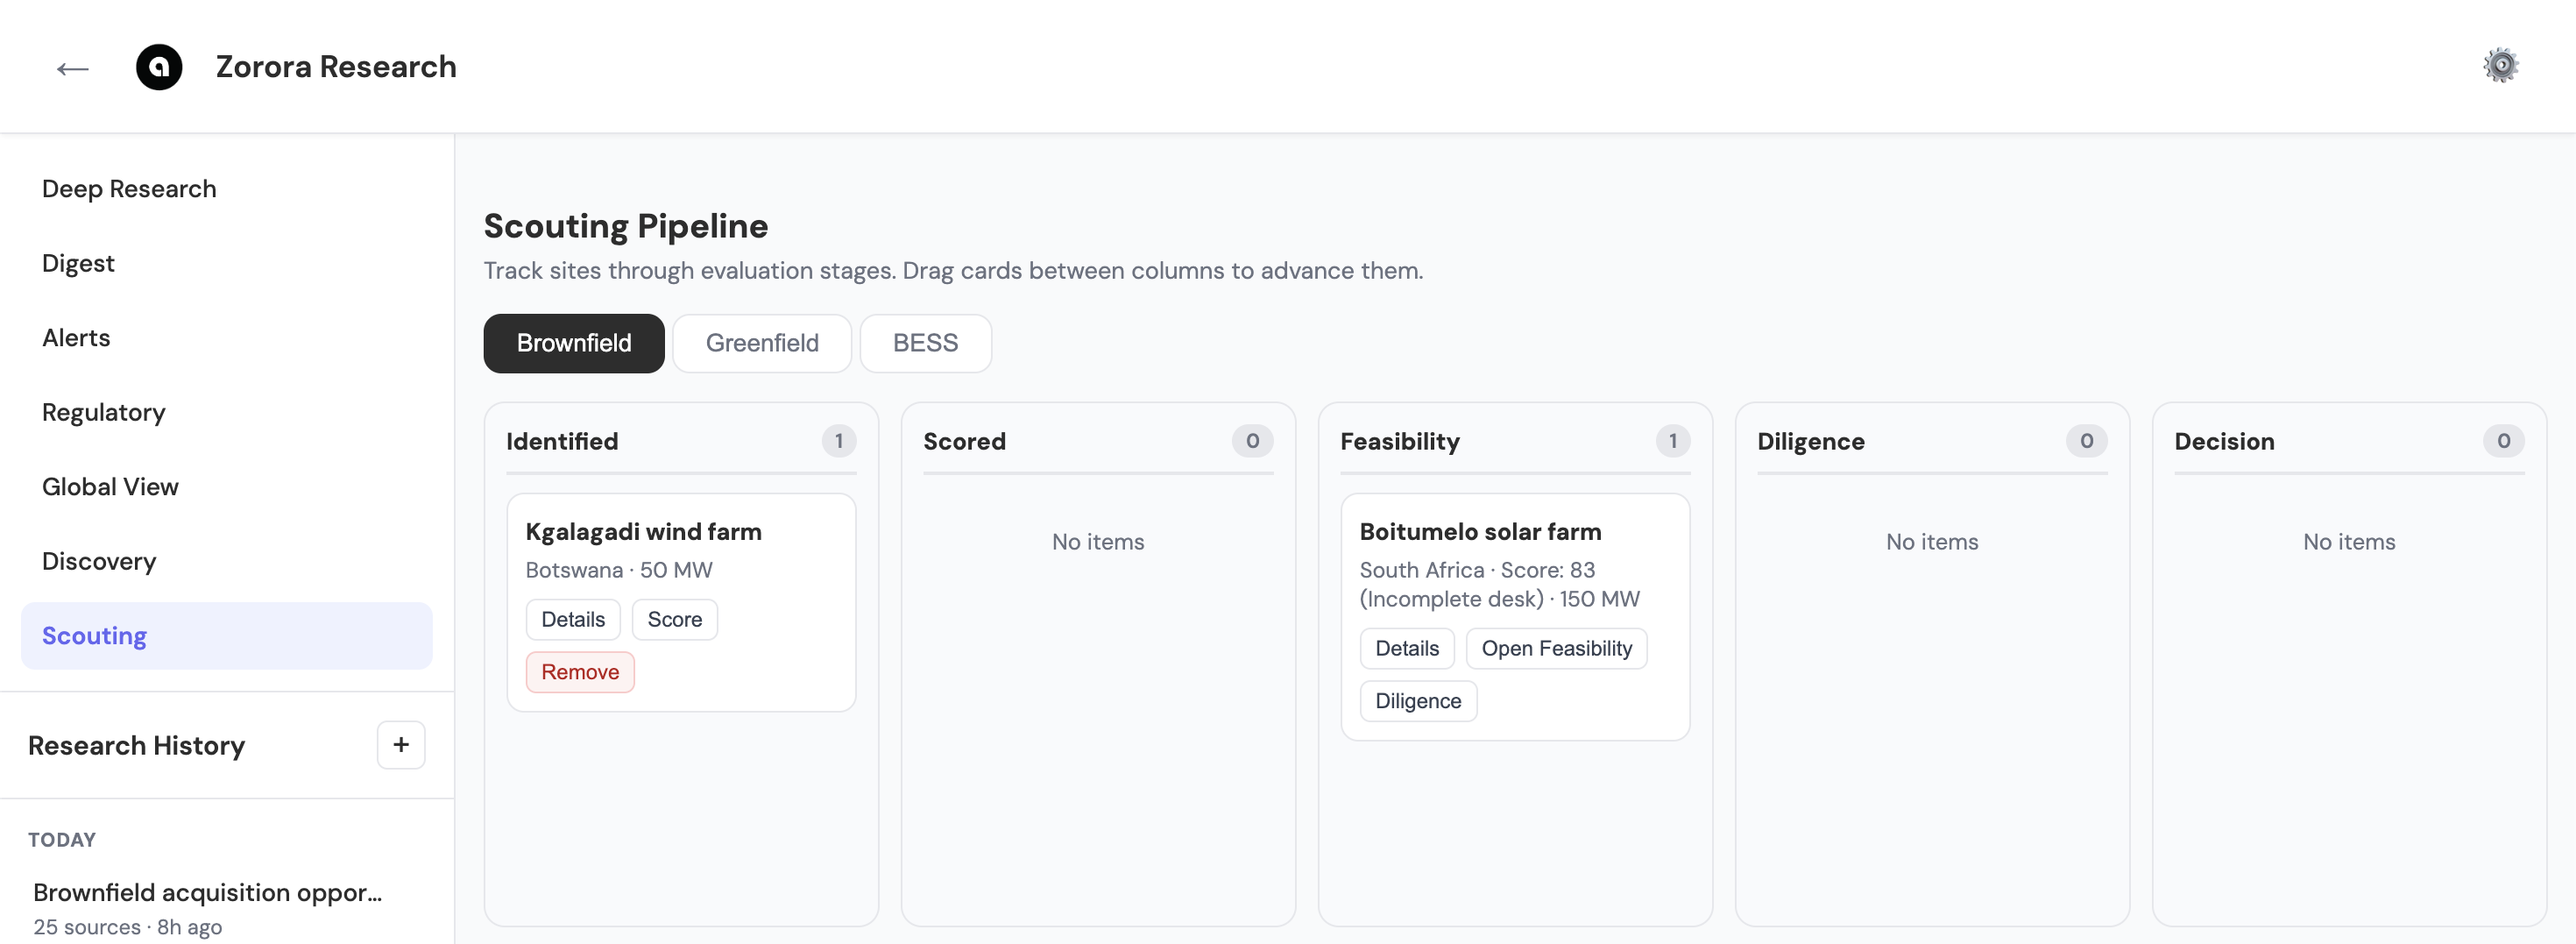
The pipeline is filtered by asset class (Brownfield / Greenfield / BESS); cards can be dragged between the five stage columns
Every site moves through five stages, shown as columns with a live count:
| Stage | What happens | Card actions |
|---|---|---|
| Identified | A candidate has been added, typically from a Discovery map popup or manual entry | Details, Score, Remove |
| Scored | Initial resource and grid scoring is complete | Details, Score |
| Feasibility | A full automated feasibility study has run across all five dimensions | Details, Open Feasibility, Diligence |
| Diligence | Brownfield acquisition diligence or greenfield development diligence is underway | Details, Diligence |
| Decision | The site has been approved, rejected, or shelved | Details |
The pipeline is scoped by asset class — Brownfield, Greenfield, or BESS — using the tabs above the columns; each tab shows only the sites of that class. Sites can be dragged between stage columns as work progresses.
Automated Feasibility Studies
Once a site reaches the Feasibility stage, opening Open Feasibility runs a study across five dimensions, one at a time:
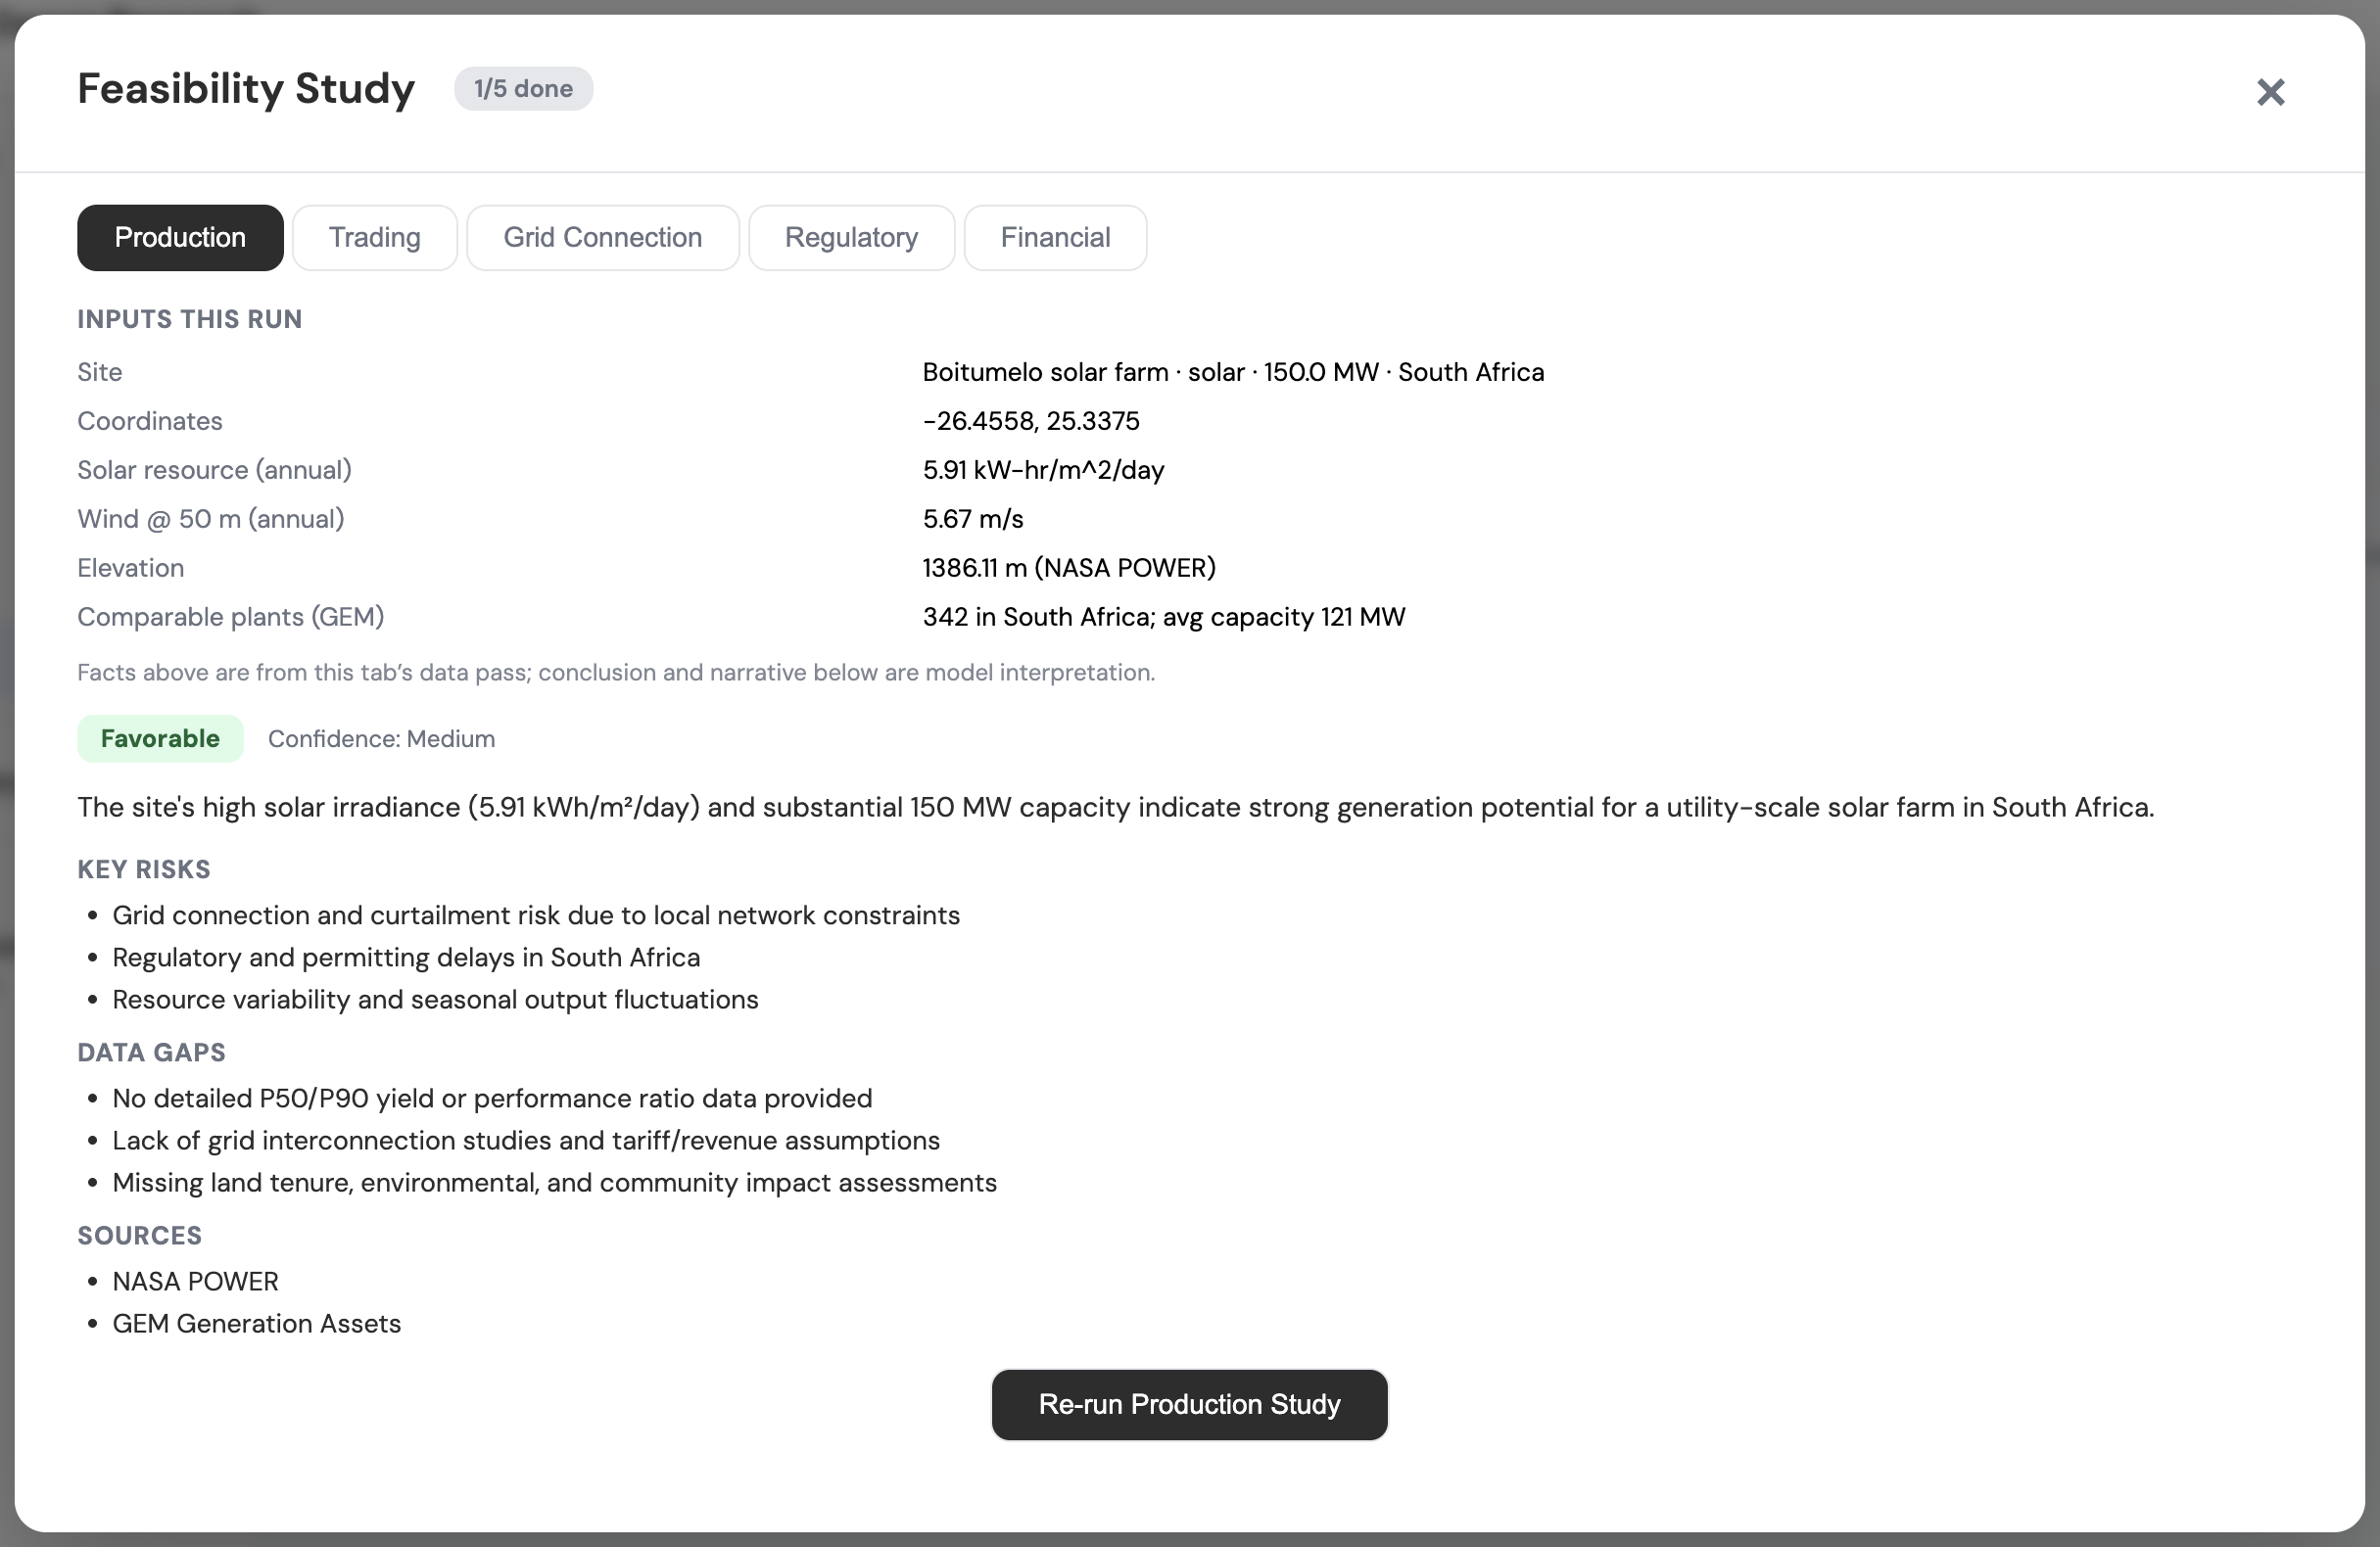
The Production tab of a Feasibility Study, showing the facts-vs-interpretation split: inputs pulled directly from data sources, then a separately labeled model verdict
| Dimension | What it evaluates |
|---|---|
| Production | Resource quality and expected capacity factor |
| Trading | Market pricing, arbitrage spread, and revenue potential |
| Grid Connection | Interconnection distance, capacity availability, and constraint risk |
| Regulatory | Licensing requirements and jurisdiction-specific regulatory exposure |
| Financial | Indicative economics given the above inputs |
A progress indicator (e.g. “1/5 done”) tracks how many of the five tabs have been run for that site. Each tab is run independently via a Re-run [Dimension] Study button rather than all five completing at once.
Within a tab, the study is explicit about what’s a fact and what’s a conclusion:
- Inputs this run — figures pulled directly from the underlying data pass (e.g. site coordinates, annual solar resource, wind speed at 50m, elevation, and comparable plants from NASA POWER and GEM), labeled as coming from that tab’s data pass
- Verdict and confidence — a badge (e.g. “Favorable”) plus a confidence rating (e.g. “Medium”), followed by a short narrative interpreting the inputs above — explicitly separated from the facts, not blended into them
- Key Risks — specific risk factors for that dimension (e.g. grid curtailment risk, permitting delays, resource variability)
- Data Gaps — what’s missing from the current analysis (e.g. no P50/P90 yield data, no interconnection study, no land tenure or environmental impact assessment) — named explicitly rather than silently assumed favorable
- Sources — the specific feeds behind that tab’s data pass (e.g. NASA POWER, GEM Generation Assets)
This means a study can return a favorable verdict at medium confidence while still flagging real data gaps — the confidence rating and the gap list are two different signals, and neither substitutes for the other.
Site Scoring
Greenfield and BESS sites are scored using:
- NASA POWER resource data — solar irradiance, wind speed, and temperature
- Grid proximity — distance to nearest substation and available capacity
- DAM arbitrage spreads — from SAPP day-ahead market pricing
- TOU tariff differentials — time-of-use rate spreads relevant to storage economics
Brownfield sites entering the pipeline mid-stream (e.g. an existing asset under acquisition consideration) skip straight to feasibility or diligence scoring rather than the greenfield resource-scoring path.
From Discovery to a Decision
Stage columns advance by manual drag, not automatically — the pipeline’s own subtitle puts it plainly: “Track sites through evaluation stages. Drag cards between columns to advance them.” A typical flow:
- A candidate is added via + Scouting from a Discovery map popup, landing in Identified
- Run Score for baseline resource and grid scoring, then drag the card to Scored
- Run the five-dimension feasibility study (Open Feasibility) once the card is in Feasibility, producing the per-dimension reports above
- Run Diligence — tariffs, regulations, performance, vendors (see Diligence Search) — then drag the card to Diligence
- Drag to Decision once the site is approved, rejected, or shelved
Related
- Discovery — where candidates are found before entering the pipeline
- Deep Research — the diligence and research queries scoped to a Scouting site
- Data Sources — NASA POWER, SAPP, and grid data underlying scoring
- Authentication & Subscriptions — tier gating and the
featuresentitlement flag