
Global View
Global View has two top-level tabs over the same Leaflet/CARTO map styling: Indicators, an interactive country map for market and news data, and Shipping, live AIS tanker tracking.
Indicators
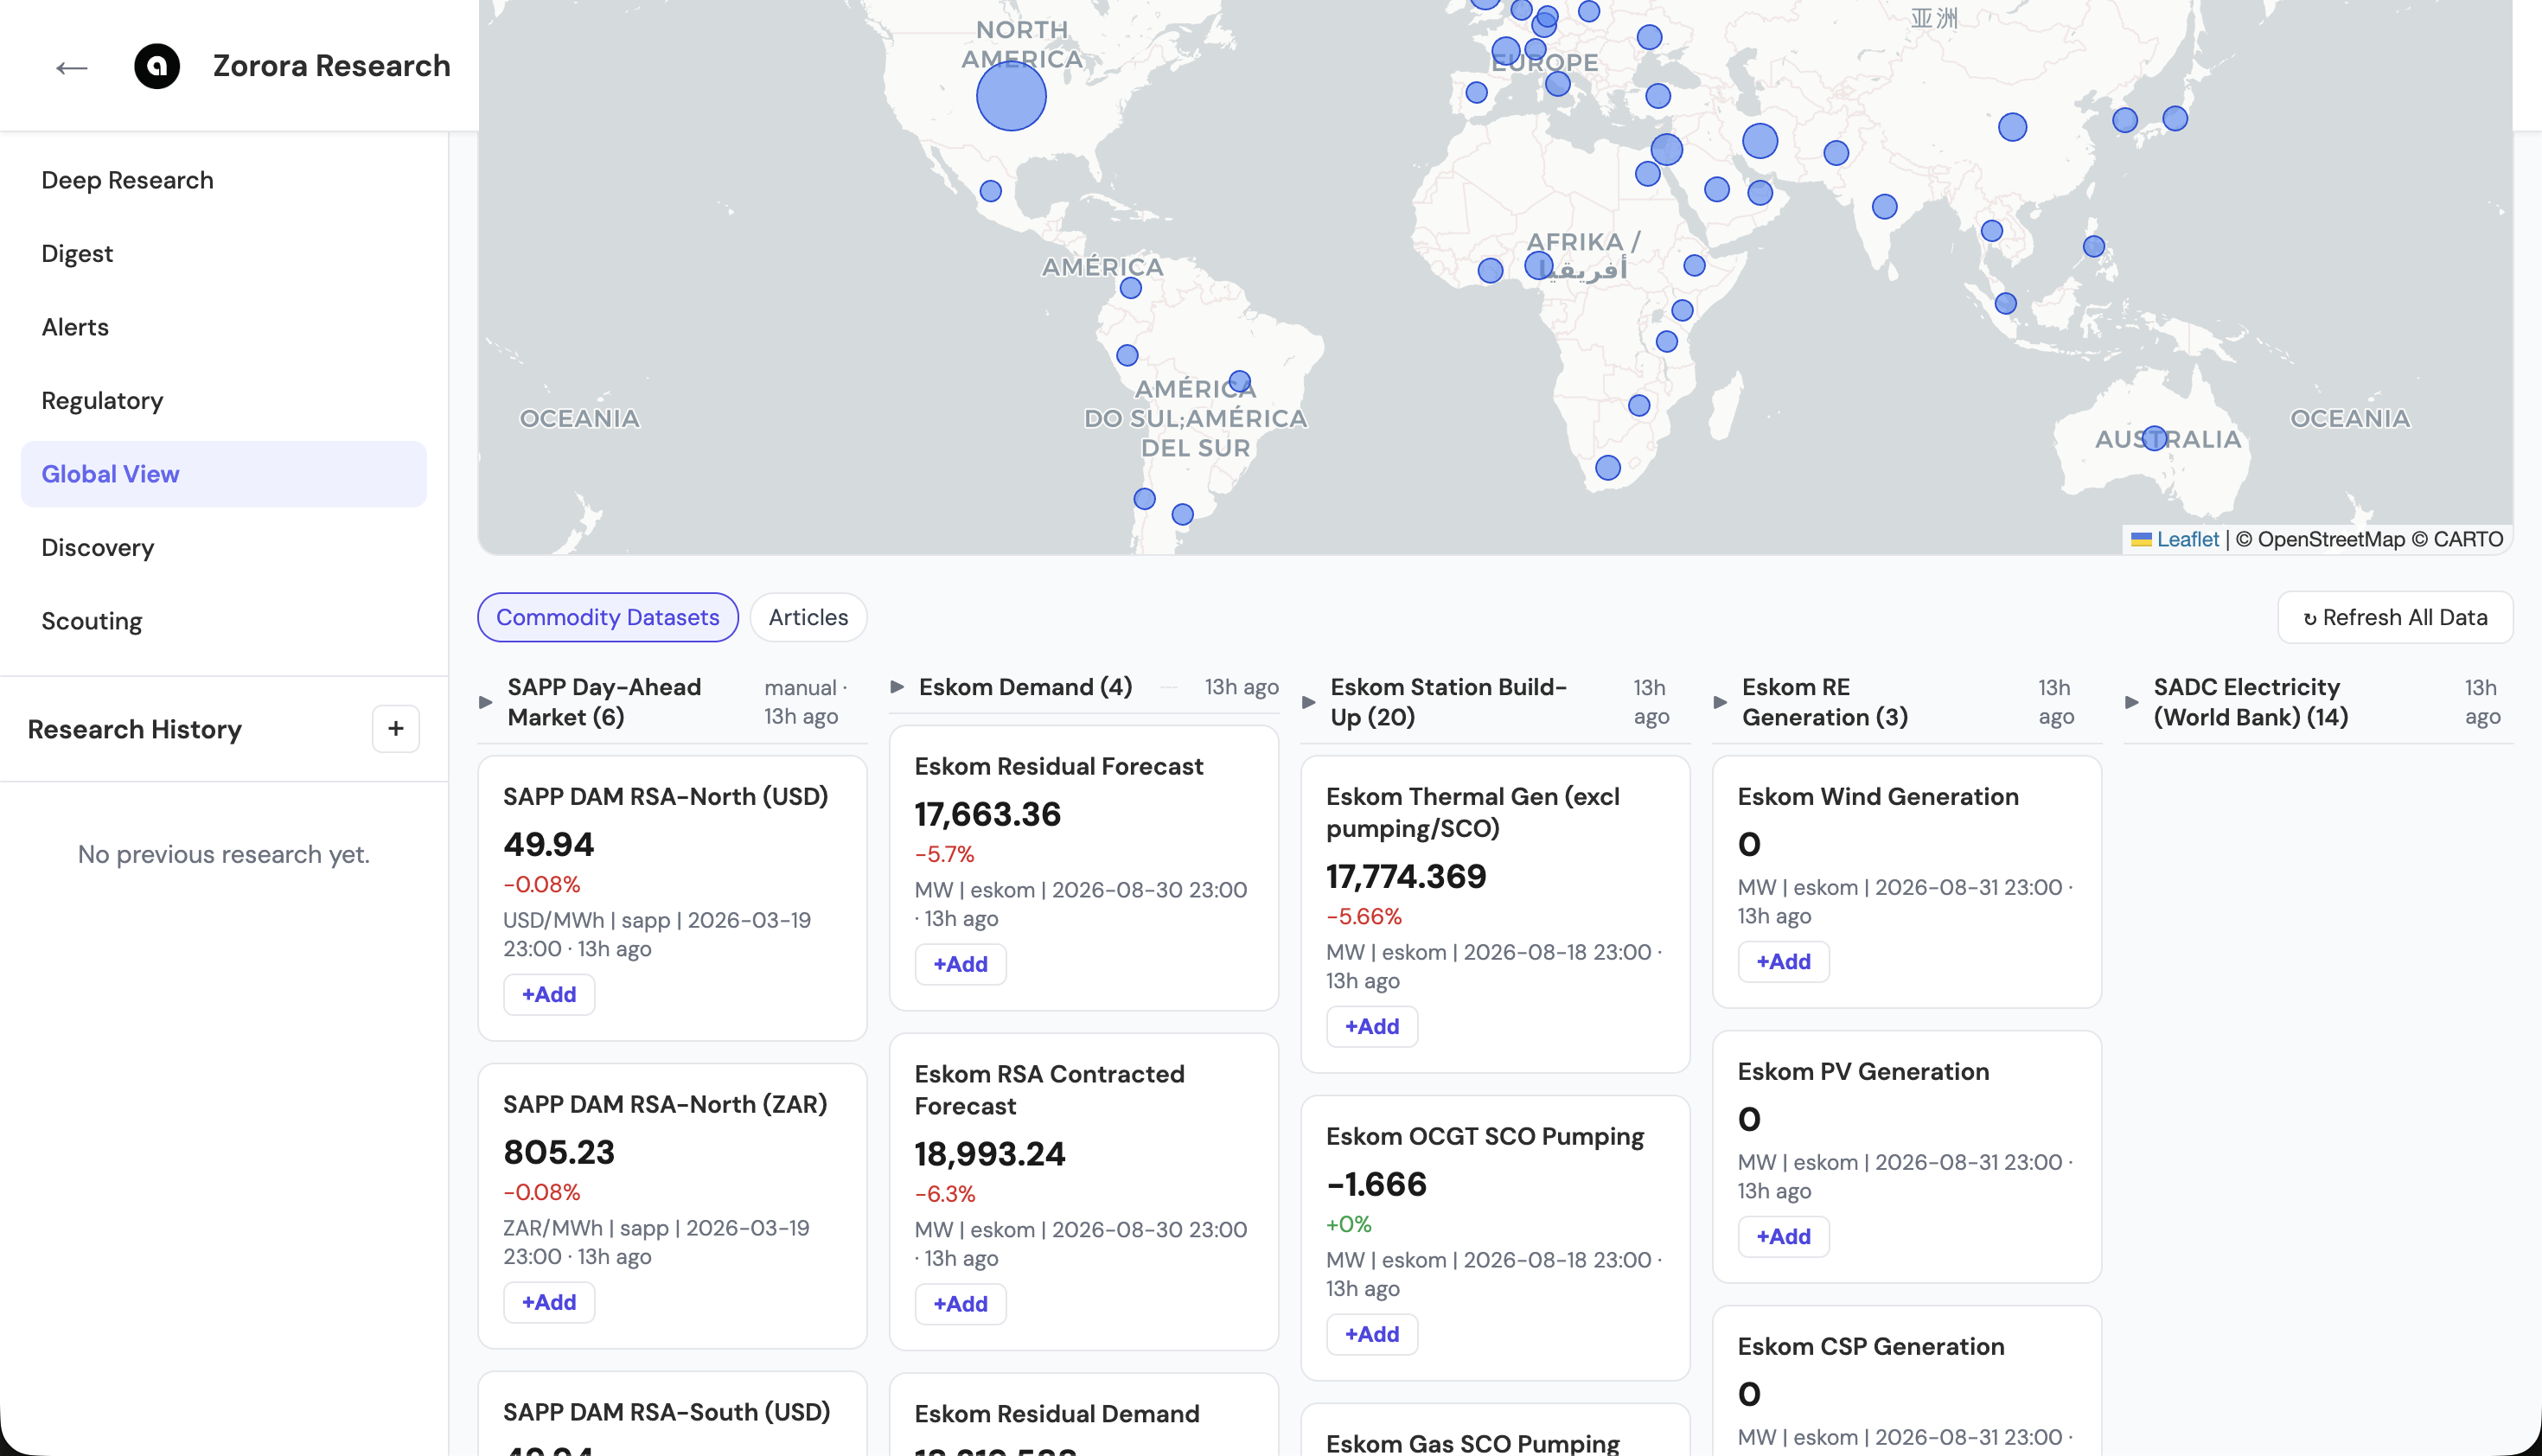
Click any country to filter by topic and source; commodity, FX, and energy series display as cards below the map
Clicking a country on the map opens a popup with:
- Article count for that country
- A topic breakdown (e.g.
economy_politics,energy,ai,geopolitics) with counts per topic
Below the map, toggle between Commodity Datasets — live FRED-backed commodity, FX, and treasury-rate cards with day-over-day change — and Articles, the underlying geo-tagged news feed. Article geo-tagging coverage is shown as a percentage at the top of the view.
Shipping

Marker clustering groups nearby vessels; clicking a cluster or vessel opens live AIS detail
The Shipping tab tracks live AIS tanker positions via TankerMap, with:
- Vessel type and Cargo filters
- Cluster markers toggle, for dense shipping lanes
- A manual Refresh control, with the last-updated timestamp shown alongside the vessel count
Clicking an individual vessel marker shows its IMO number, flag, vessel type, deadweight tonnage, cargo status, speed, destination, and status (e.g. “At anchor”), along with the AIS observation timestamp.
The live vessel API (
GET /api/shipping/vessels/live) requires the Professional tier or above. See Authentication & Subscriptions.
Related
- Data Sources — FRED commodity/FX feeds and TankerMap AIS data
- Authentication & Subscriptions — tier requirements for live Shipping data
- Deep Research — staging an Indicators article or dataset into a research query